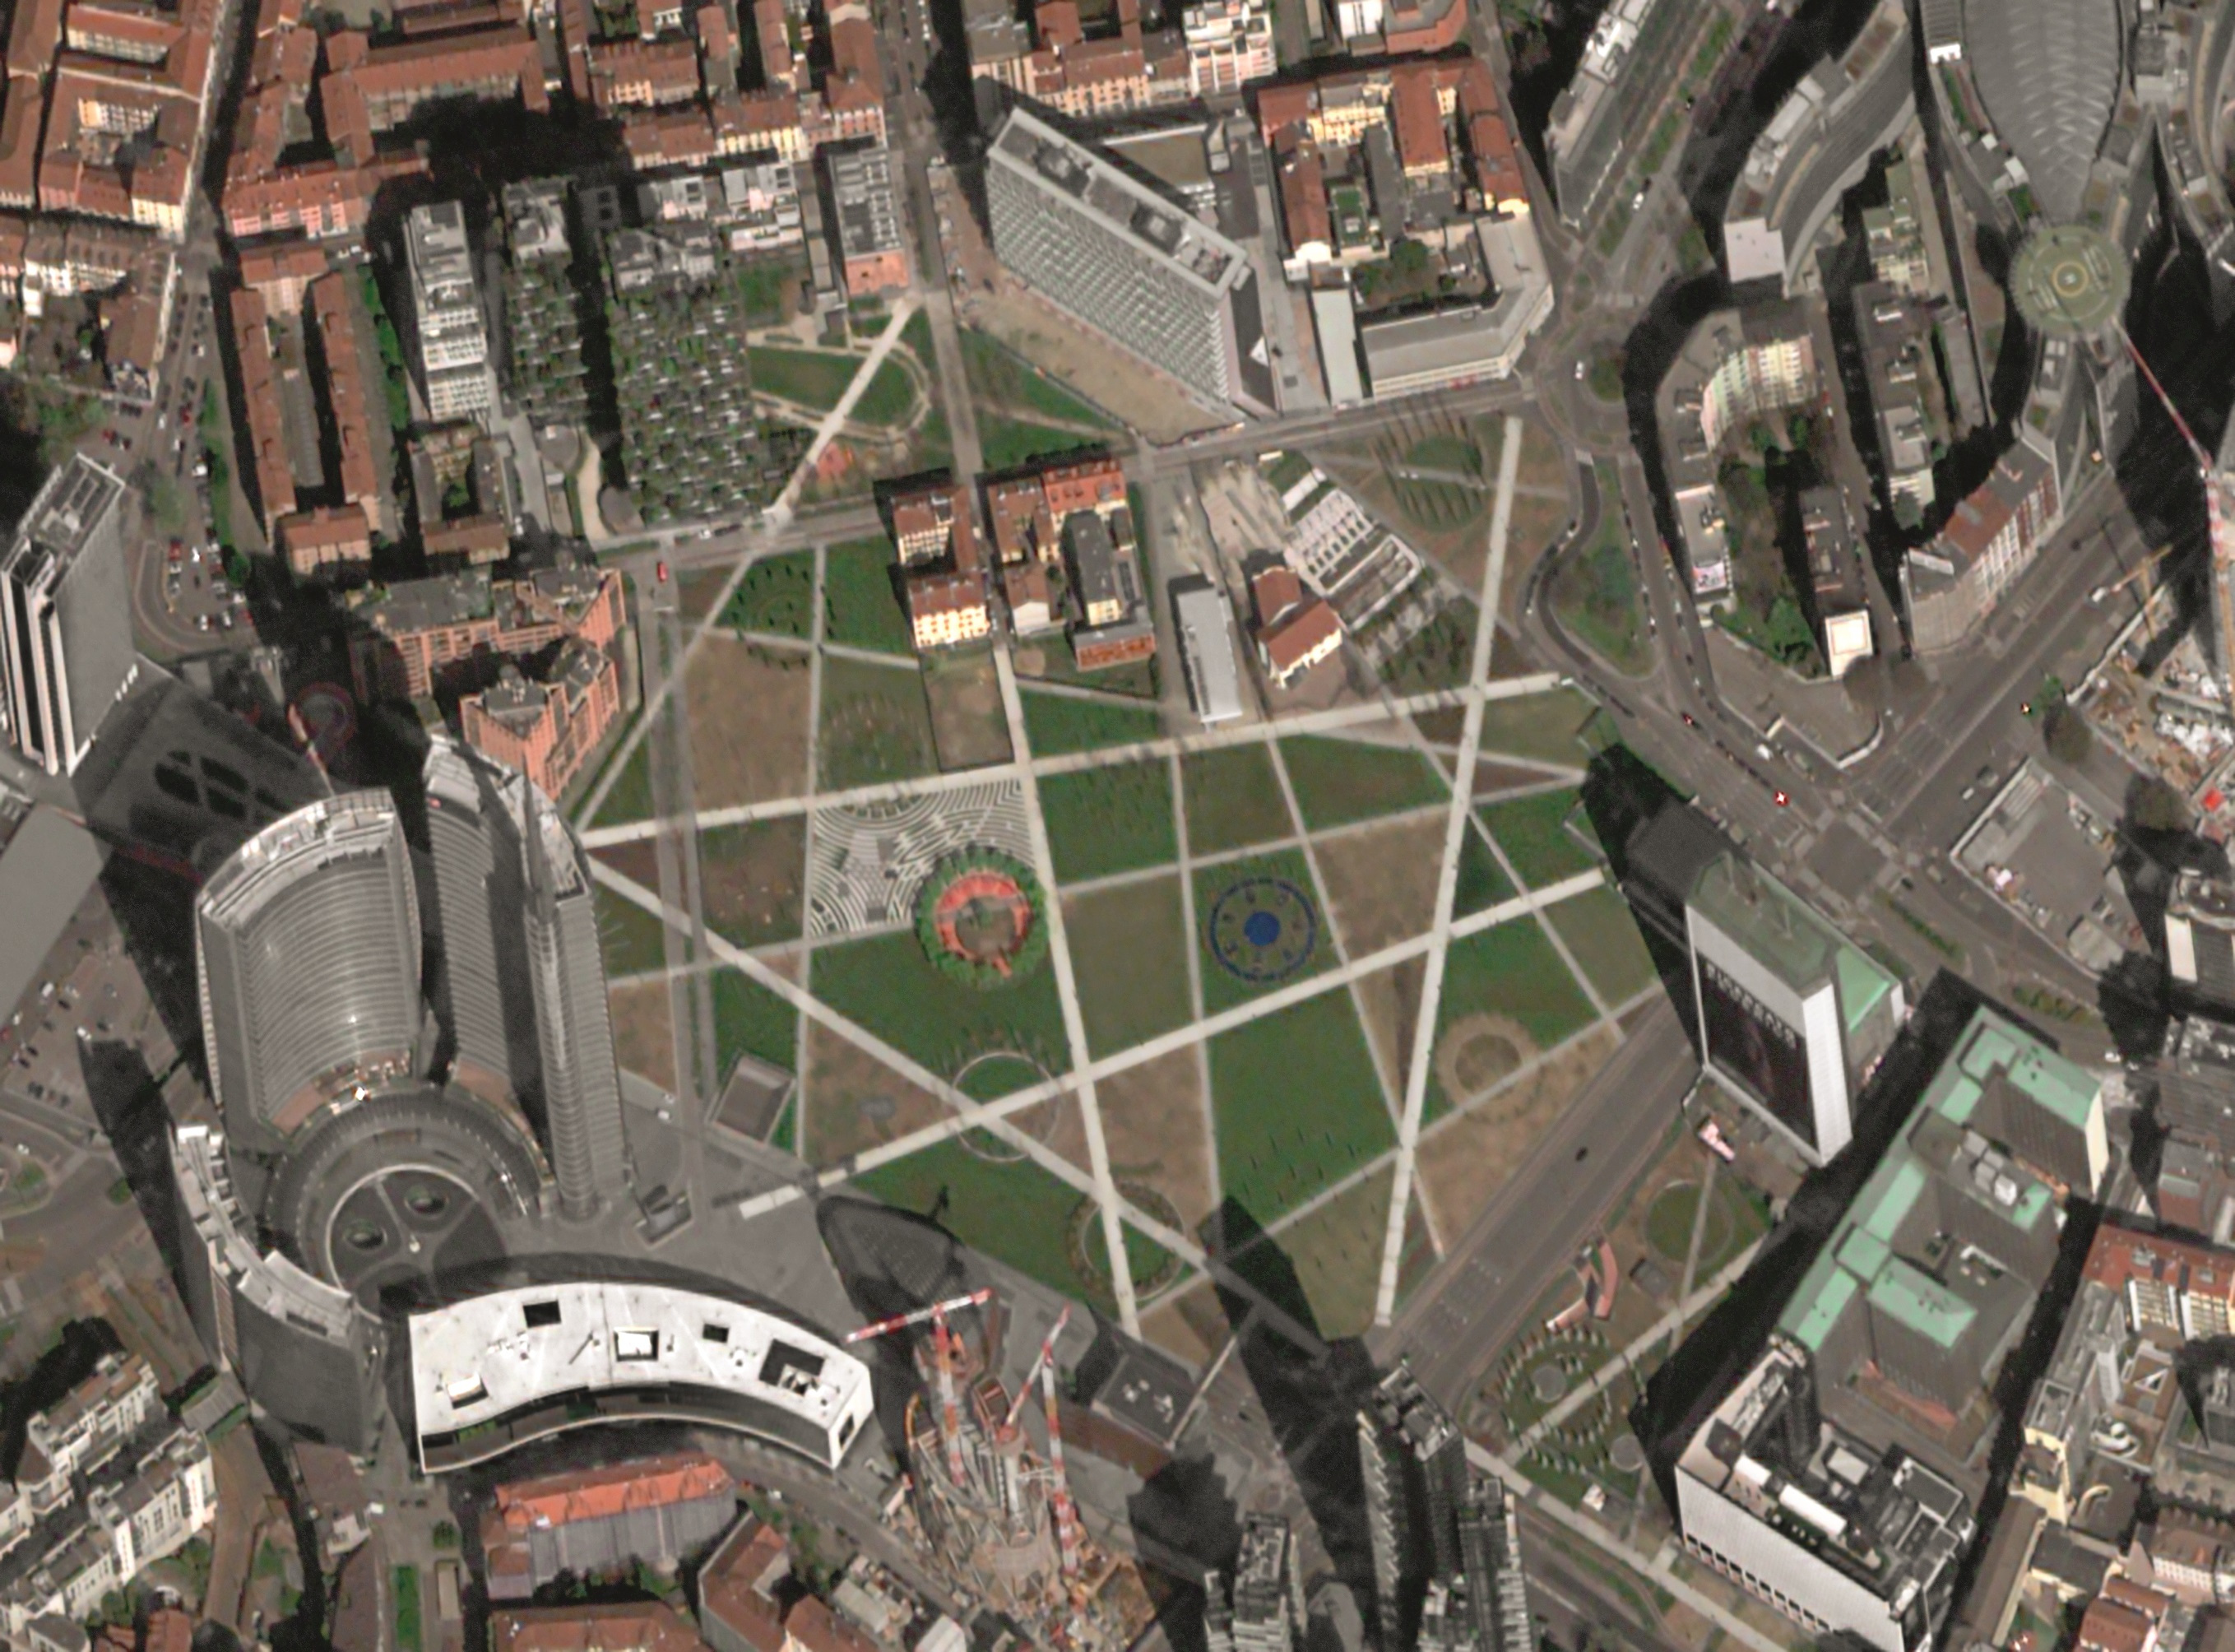
Urbanisation and climate change are increasingly interconnected, with metropolises and cities often affected by heatwaves and storms – extreme weather phenomena that the typical urban landscapes amplify with significant effects on their populations. With this in mind, architects and engineers experiment with new interpretations of the relationship between people, cities and nature by developing sustainable infrastructures, in line with the Sustainable Development Goals (SDGs) of the UN 2030 Agenda. In this case, SDG 9 – Build resilient infrastructure, promote inclusive and sustainable industrialization and foster innovation.

Milan, Italy. WorldView-2 Image © DigitalGlobe (2020)
“Love Planet Earth” Calendar – Shots associated with December 2021
This month’s photo is a super high resolution shot of Milan’s business district, featuring Piazza Gae Aulenti and the Vertical Forest. It is an area designed with sustainability in mind, rich in biodiversity, green spaces and bodies of water, which makes us reflect on how the growing attention to the climate and environment are increasingly influencing urban projects.
Space technology makes an important contribution to the monitoring of this phenomenon through international programmes focused on the region. Leonardo plays a significant role in these initiative through satellite manufacturing alongside Thales Alenia Space, in data acquisition, services and applications with Telespazio and e-GEOS, and through developing sensors – the ‘eyes’ of the satellites – many of which are created in Leonardo’s laboratories. Cultivating the potential of space technologies to support sustainable development is one of the pillars of the company’s Be Tomorrow - Leonardo 2030 strategic plan, and part of our overall Sustainability Plan.
We spoke to Monica Palandri, Project Manager at the e-GEOS Geo Information Centre to find out more.

Monica Palandri
What can satellites do to monitor and counter extreme weather phenomena at the urban level, while fostering the development of sustainable infrastructure?
e-GEOS has carried out several studies and projects related to climate change – from the melting of glaciers, to the decrease in available water resources, to assessing increasing desertification. These phenomena, which often overlap, are happening rapidly and are therefore difficult to manage. Designing new urban spaces taking into account these factors is not easy, even in the face of a constantly growing urban population. Among the most interesting projects that e-GEOS has worked, is the identification of the hottest urban areas – the so-called ‘heat islands’ – in support of the city of Milan. During the summer, when there are 4-5-day heatwaves, satellite data has enabled e-GEOS to map the neighbourhoods and areas most exposed to these phenomena, which can be five degrees hotter than other areas in the region. This data is obtained directly from NASA and ESA satellites, such as Sentinel 3, which, when integrated with satellite data at a higher resolution (30 meters), allows us to estimate temperature measurements at the sub-neighbourhood level through downscaling algorithms. Once the heat island maps have been defined, geoinformation tools are superimposed on the vulnerability maps of urban centres that indicate, for example, the presence of children under 10 or people over 70. With this picture available, public administration can develop out natural-based solutions, encouraging the implementation of sustainable infrastructure such as green roofs, vertical gardens, and water structures such as ponds and lakes that help lower temperatures. These natural-based solutions have additional positive impacts too; being made from plant-based materials, they increase the permeability of the soil, improving the water capacity and mitigating runoff to counteract flooding. This capacity, however, has been reduced over the years due to land consumption, especially in urban areas.
What advantages do e-GEOS services offer?
The satellite data provided by e-GEOS is superimposable with public administration maps. The maps, which are continuously updated, provide highly useful information for those involved in urban planning and designing public spaces, thanks to the information that is integrated with the data collected by the sensors in situ. This gives urban planners the ability to define the planning of all green spaces.
This data is also important for the Civil Protection when extreme weather occurs, by allowing them to organise immediate responses during heatwaves, to establish how and where to intervene, as well as pre-alerting nearby hospitals.
What are additional applications of the platform?
Once the design and implementation of sustainable and resilient infrastructures within urban spaces have been completed, we can monitor and evaluate the benefit brought by these new urban typologies. For example, in the case of Milan’s business district, we can forecast the level of temperature decrease in that area compared to its previous conformation. These evaluations can also be extended to the measurement of the quality of the area or other parameters, to provide local governments and public planners with the data and tools needed to make decisions, while considering all the area's interacting factors.
For example, e-GEOS has recently concluded the project Life METRO ADAPT – strategies and measures for adapting to climate change in the Metropolitan City of Milan. This project is now in the reporting phase with the European Community, which has expressed great satisfaction with the results achieved. In addition to having adopted maps to monitor heatwaves, vulnerability, hazard and risk, e-GEOS undertook a study of the variation of the decrease of green indices due to the increased temperature in the agricultural areas of Milan’s Parco Sud. The city used this valuable information to develop the Metropolitan Territorial Plan that was adopted in July 2021.
Other relevant studies have also been carried out in Rome with help from Italian environmental association Legambiente. In this case, data from Copernicus (Sentinel-3) was used to identify a synthetic map of heat islands. In one of the hottest neighbourhoods, we were able to identify intervention priorities. This analysis is useful to plan where to focus investments and/or incentives to get maximum benefits from redevelopment (urban planning offices, businesses, individuals, etc.).
To learn more about Earth observation technologies and solutions, check out other interviews.
Discover the Love Planet Earth 2021 Calendar

